CREA Interactive Chart Documentation
Overview
This is the official documentation for the CREA Interactive Chart, a dynamic and interactive graph available on our website. The chart provides a comprehensive view of the work produced internally, with a range of features that allow users to customize their view and download data.
A. General Buttons
A.1 Add Variables
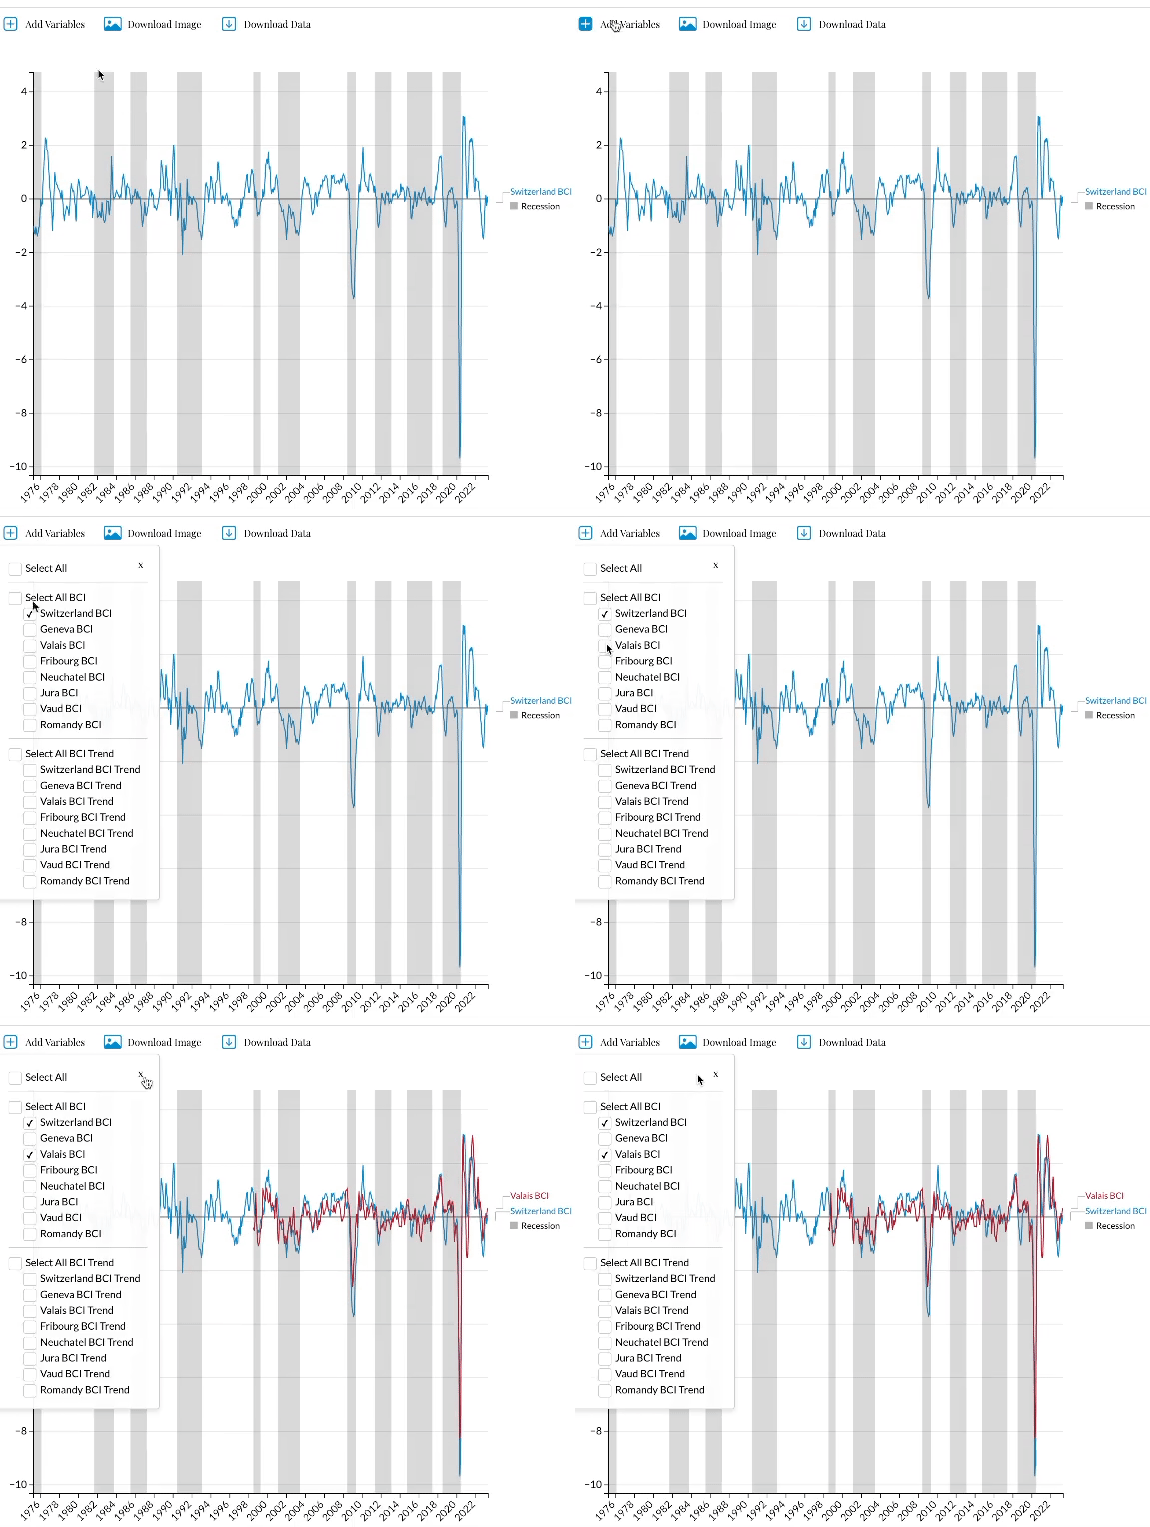
The "Add Variables" button opens a dropdown menu featuring checkboxes. Each checkbox corresponds to a different line in the plot, representing a variable. Users can select or deselect these checkboxes to add or remove lines from the plot.

A.2 Download Image
The "Download Image" button allows users to download the currently displayed plot as an image file. The "currently displayed" refers to the plot in its current state, accounting for any changes the user has made (e.g., variable selection, time period adjustment with the slider).
A.3 Download Data
The "Download Data" button allows users to download the underlying data for the currently displayed plot. This includes any modifications made by the user. For instance, if a user removes certain variables from the plot, the downloaded data will also exclude these variables.
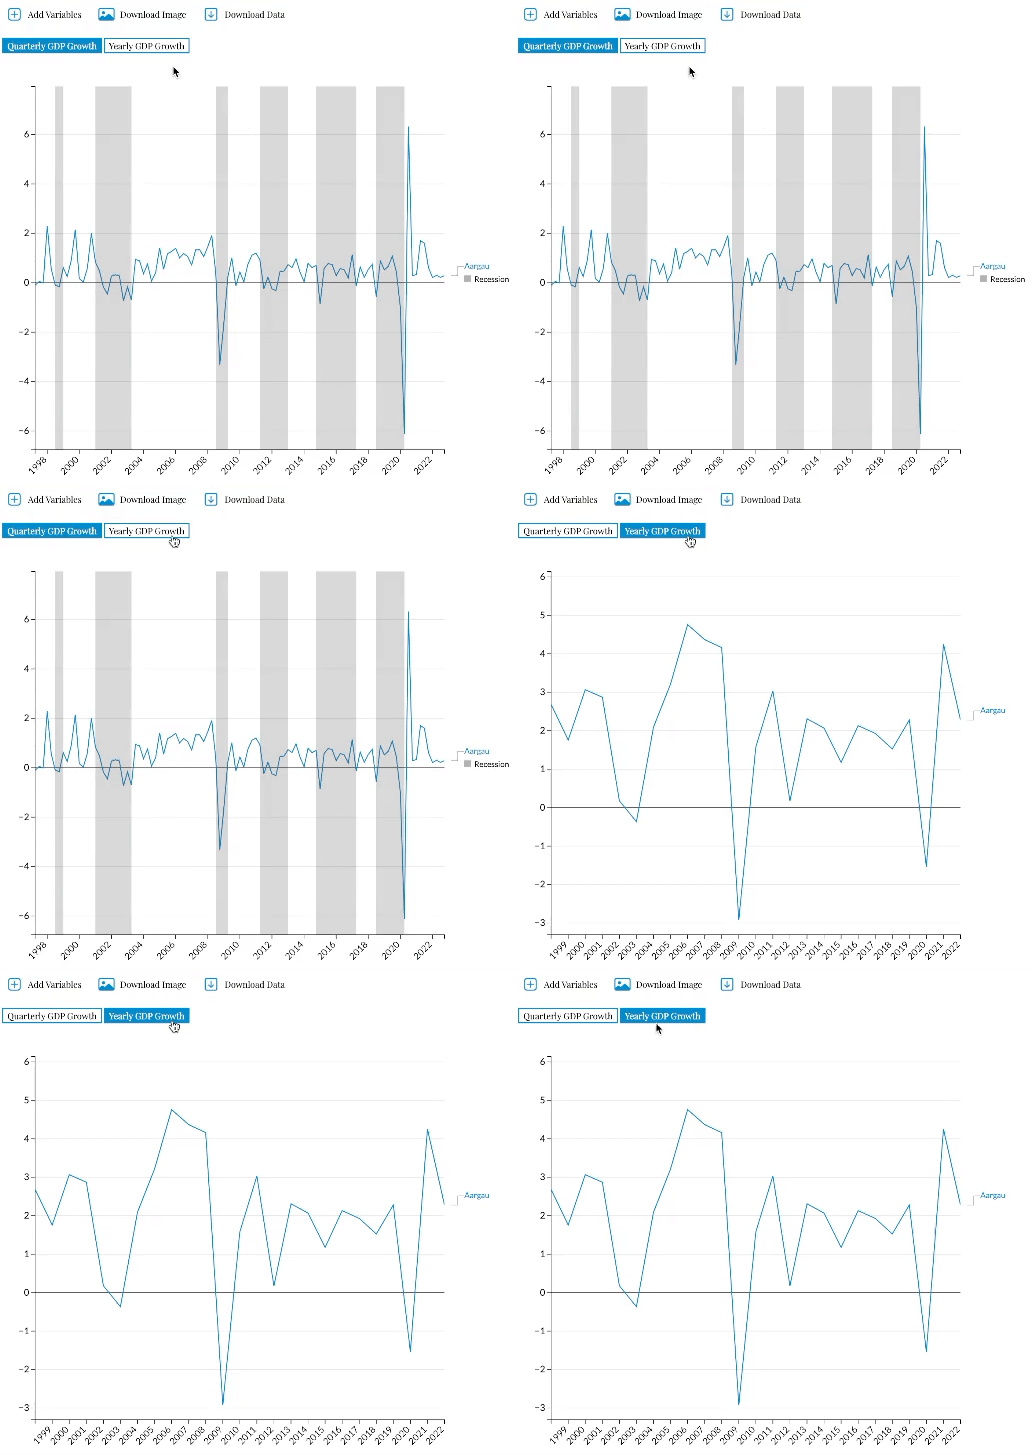
B. Series Selection Buttons
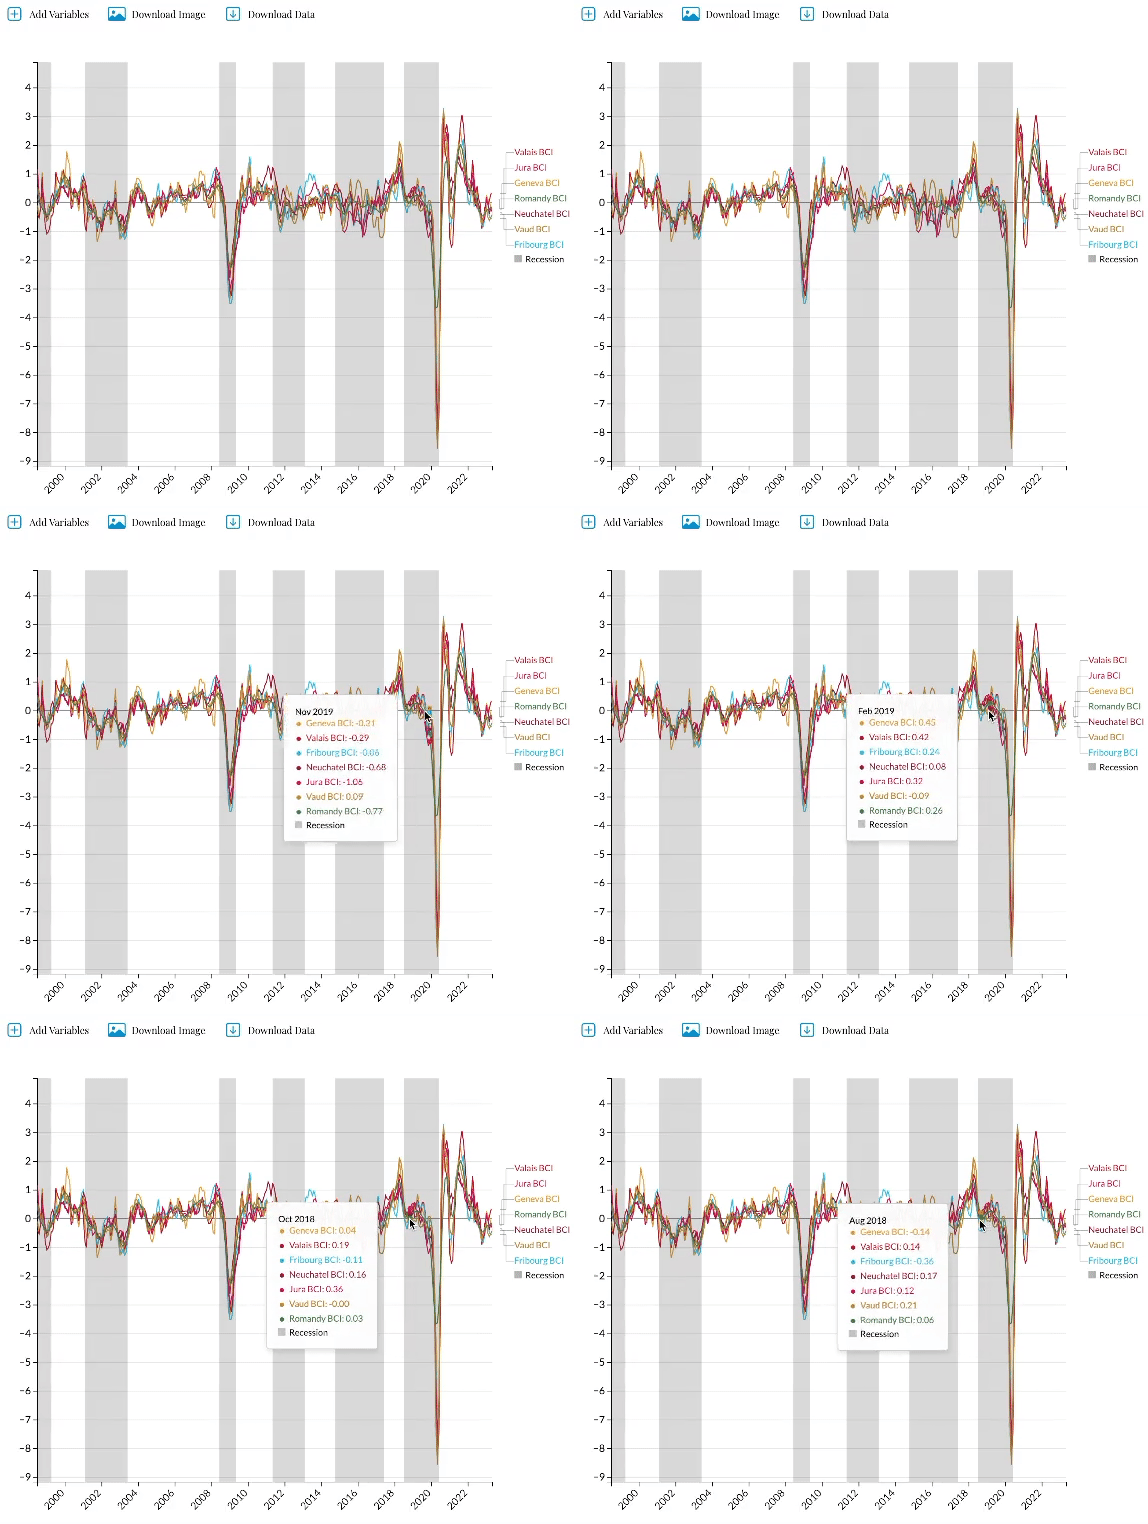
The time-series lines represent the variables that the user has selected via the "Add Variables" button. Hovering the mouse over a line will trigger a tooltip box that shows the line's value and date.

C. Plot
C.1 Lines
The time-series lines represent the variables that the user has selected via the "Add Variables" button. Hovering the mouse over a line will trigger a tooltip box that shows the line's value and date.

C.2 Side Legend
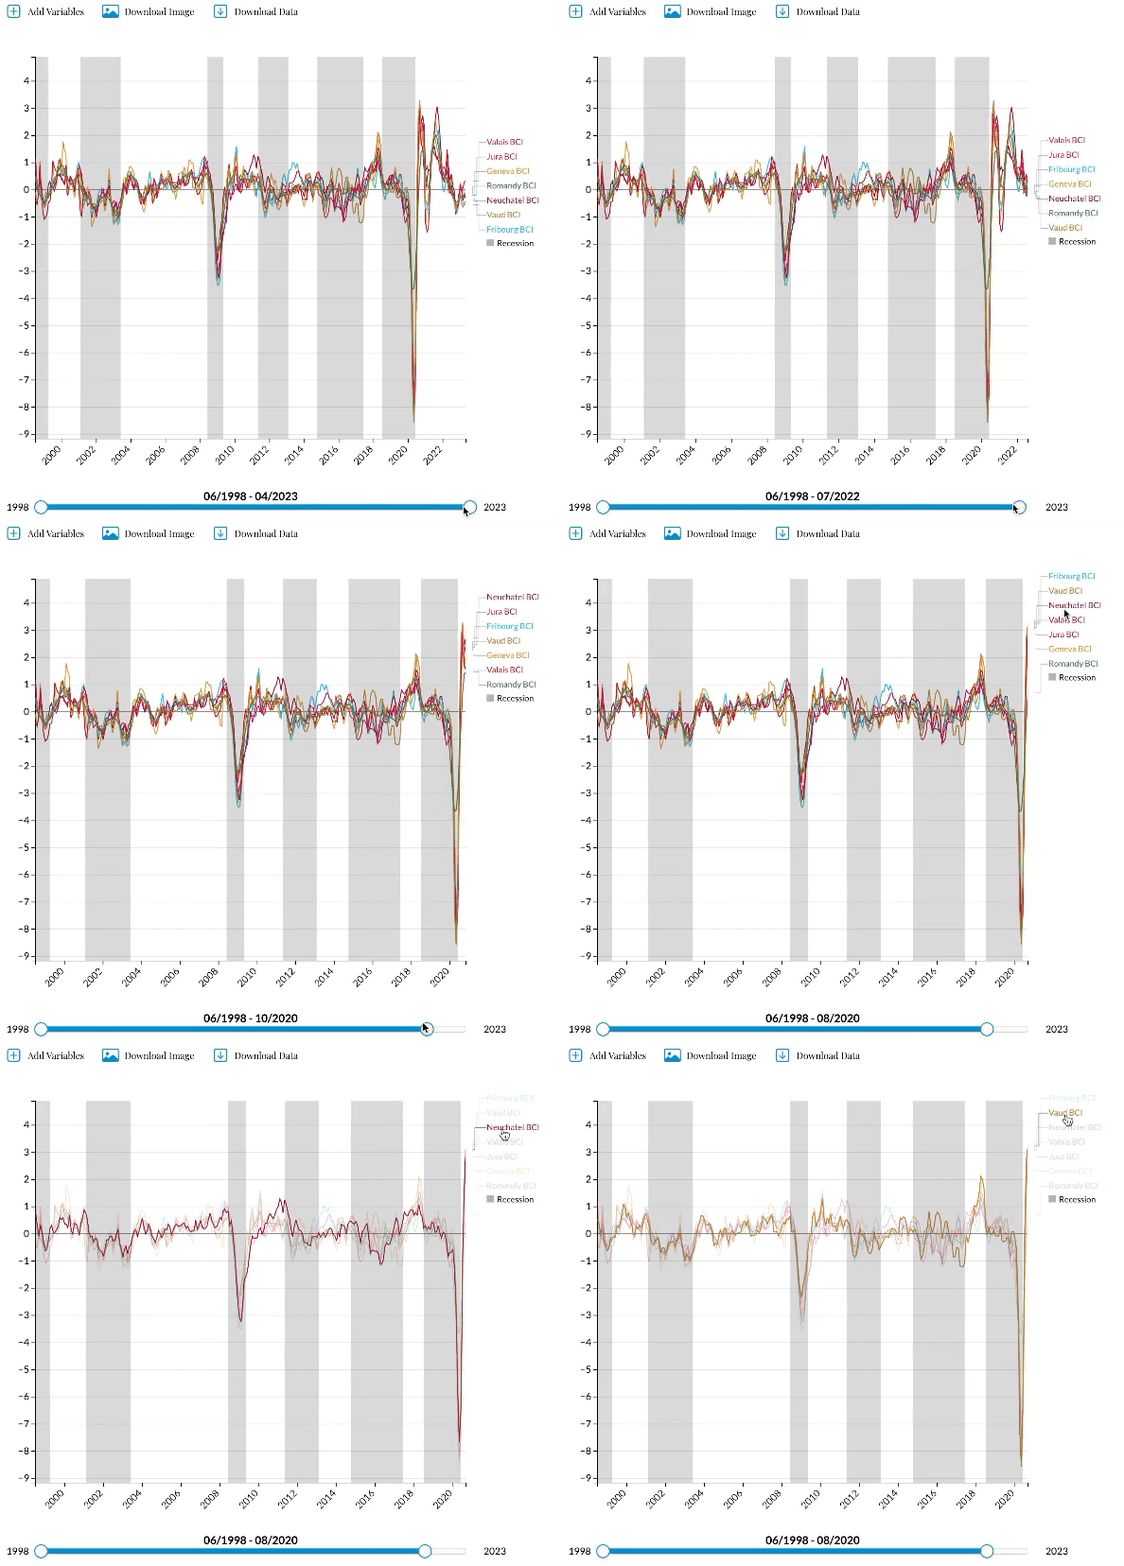
The side legend provides the name of each line. If multiple lines are displayed, users can click on a name in the legend to highlight the corresponding line and dim the others. Reclicking on that name brings all the lines back to the same opacity. The legend entries are ranked by their corresponding line's last value, with the highest at the top and the lowest at the bottom. When the time period is adjusted, the legend entries rearrange themselves accordingly.

D. Slider
D.1 Minimum Date
Located at the far left of the slider, this represents the earliest date in the data series.
D.2 Maximum Date
Found at the far right of the slider, this marks the latest date in the series.
D.3 Current Date Range
This is the range of dates currently selected via the slider and is located in the middle of the slider, slightly above it.
D.4 Slider Handles
The slider has two round handles that can be moved independently or together to adjust the date range. To move both handles together, click on the slider's progress bar and drag left or right.
License
The code of CREA Interactive Chart and the underlying data are licensed under CC BY 4.0.
The recession data used in this chart is sourced from FRED (Federal Reserve Economic Data), provided by the Federal Reserve Bank of St. Louis.
Federal Reserve Bank of St. Louis, OECD based Recession Indicators
for Switzerland from the Period following the Peak through the Trough [CHEREC],
https://fred.stlouisfed.org/series/CHEREC